Imagine you are the head of an SEN department and that you started at your current school part way through the year. Your new school takes SEN seriously and so your job role automatically elevates you to the lofty position of an assistant headteacher, which gives you a seat at the table along with all the vendor coffee you can drink.
With the end of the academic year nigh, your honeymoon period is quickly coming to an end. You tidy the ever-sprawling mess on your desk and find an annotated copy of your school’s last Ofsted report. Your eyes are drawn to a section you highlighted in bright fluorescent pink some time ago in preparation of your interview: something about needing to improve the outcomes of pupils with additional learning needs.
Reclining into your spring-loaded leather seat — courtesy of being an assistant headteacher — a repressed thought begins to crystallise in your head as you absent-mindedly stare through the glass-panelled view of the school. Though you would never admit to it publicly, you feel the appraisal targets imposed by you and SLT on ground-level staff do little to improve pupil outcomes. Having just taught your last Y11 lesson of the year, your mind wanders off to a pupil who struggled all along, because she struggled to read. You suspected dyslexia at the time, but, being new to the school and seeing that there was no mention of it on the school’s system, you let it go.
Having a reduced timetable by virtue of your being upper-management, you decide now is the time to kill two birds with one stone: you want dyslexic pupils to be better identified and you want to improve their attainment. You want next year’s ground-level staff’s appraisal targets to be linked to this, somehow.
Though you do not consider yourself an expert in dyslexia, you are widely read. You know that the word dyslexia is a modern term used to encapsulate what was once called congenital word blindness — a phrase used to describe people who struggled to read at a level comparable to their peers. Remembering this, you suddenly have a spiritual epiphany and the word comparable resonates in your head: comparable, comparable, comparable … . You ask yourself:
is it possible to mathematically identify pupils who are not comparable to their peers?
You dust off your trusty old copy of Sheskin and find that the answer is yes, but you need data. Lots of it, ideally. You are aware that your school tests every pupil’s ability to read on entry in Y7. You open up your school’s information management system (MIS) and export a list of pupil names and reading ages for the Y7 cohort. It looks something like this:
Which of these 200 pupils have a comparably lower reading age than their peers?
At this point you feel like you are the most overworked assistant headteacher in the country. The whole point of being upper-management was to drink vendor coffee, smoke B&H, and tell others what to do, not to work hard.
That is where R comes in.
First, the continuum
The British Dyslexia Association suggest dyslexia be thought of as a continuum, rather than a discrete condition. 1
Take height, a continuous phenomenon, for instance: if we measured the heights of, let’s say, 250 high school pupils and plotted the results in the form of a histogram, we would expect to see something like this:
What this graph tells us is that
- very few people are very short, and very few people are very tall. Most people’s heights are closer to the middle — the mean average;
- the probability of finding a progressively shorter (or taller) person than the mean average gradually decreases.
This pyramid-style pattern of results, it turns out, is quite common in nature and it has a very special name to go with it: the normal distribution. This is a well-known and well-studied distribution. 2
Using our height example, and assuming we measured the heights of enough pupils, our results would eventually look like the curve below.
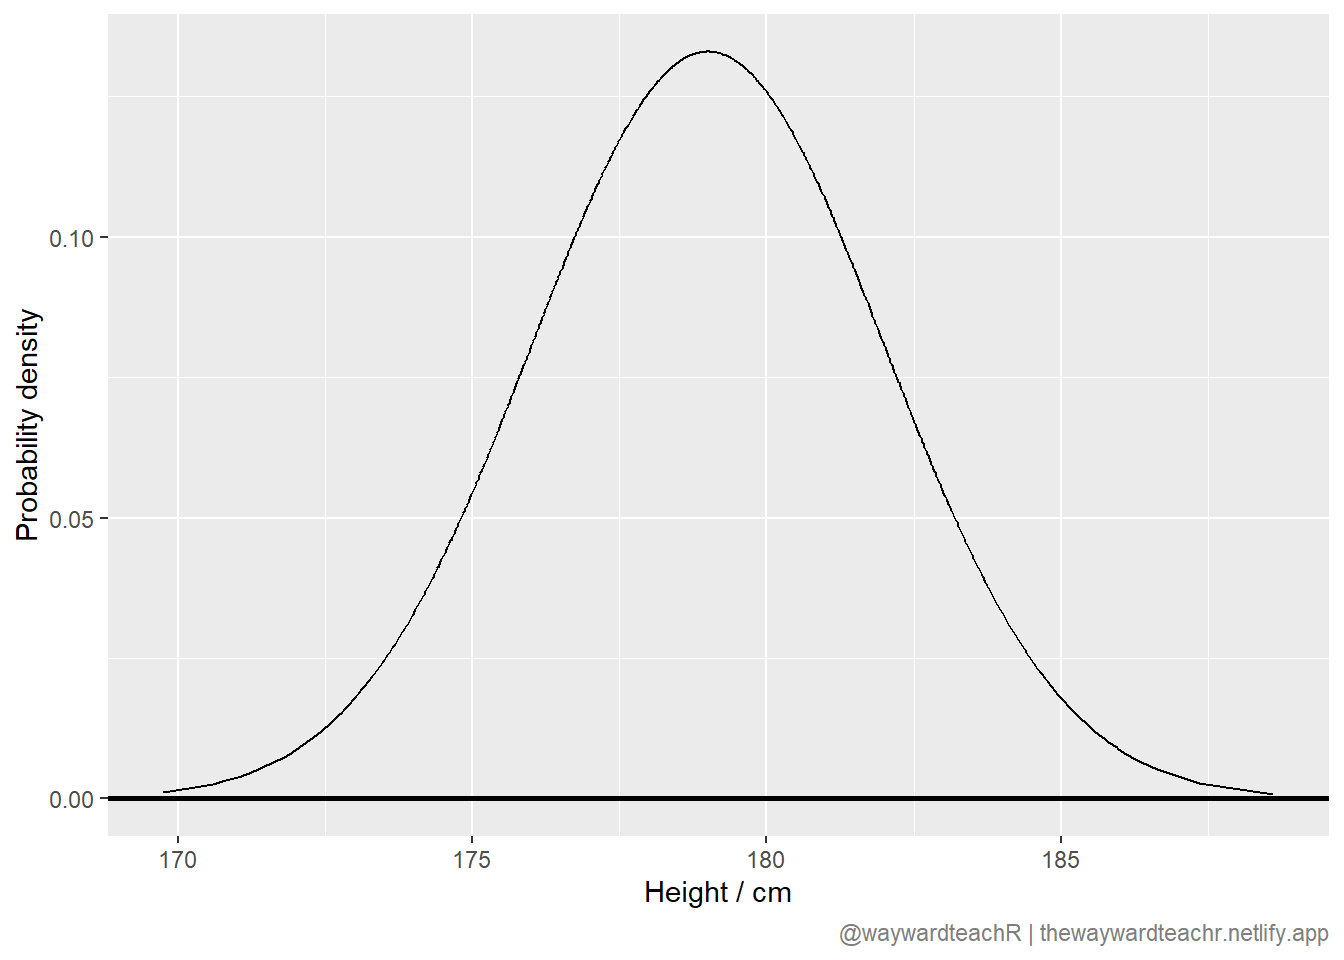
Now that you know all that:
how short (or tall) does someone have to be before we say they are different to the majority?
In the social sciences, most people take this to be anything outside of a 95% likelihood — the tail ends of the normal distribution. This is shown as the shaded regions in the graph below.
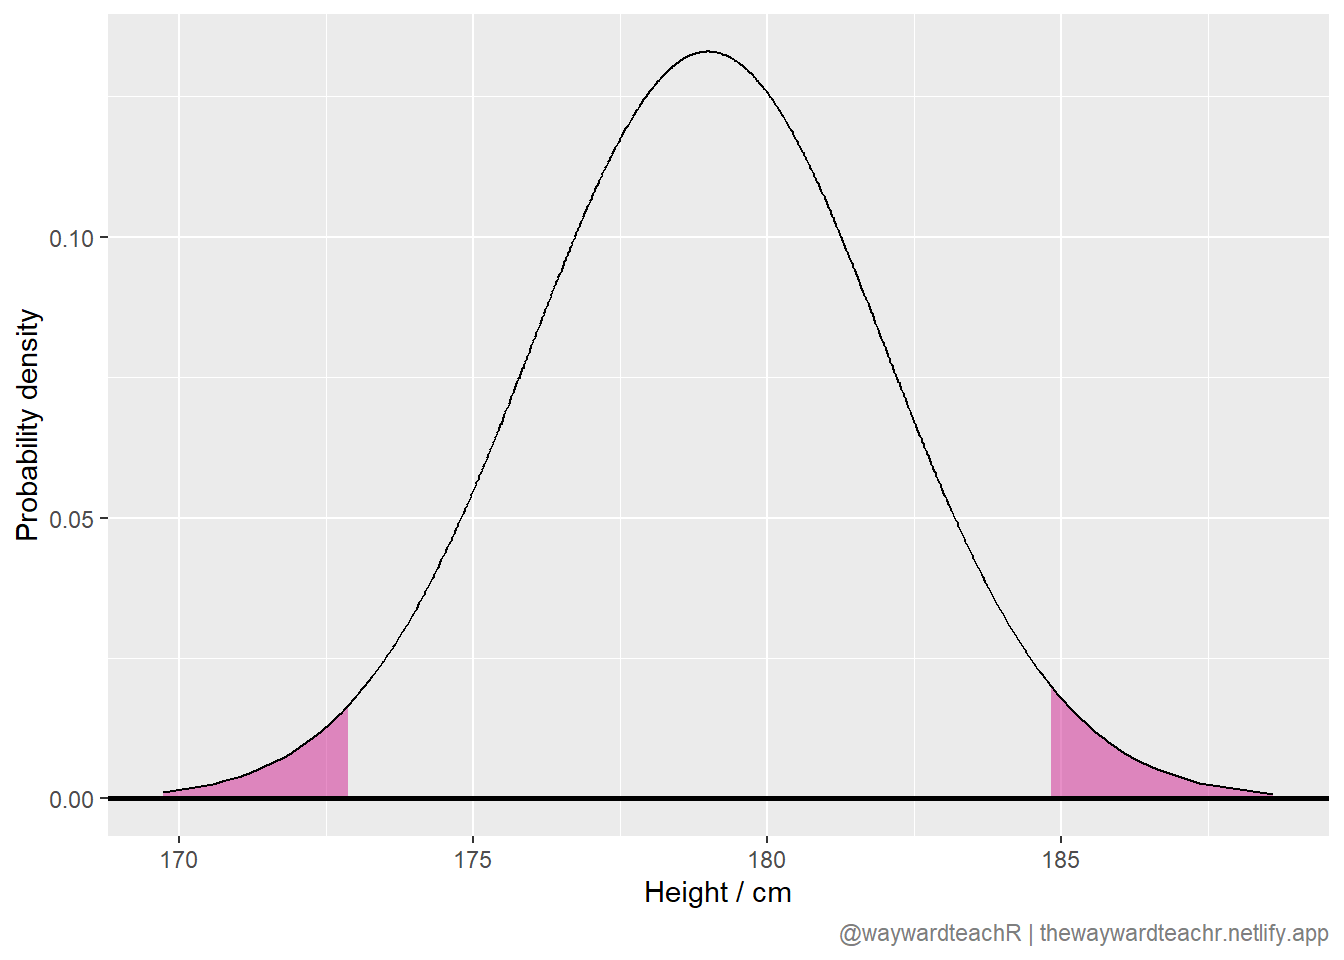
In maths-speak, these are results greater than \(\pm 2 \sigma\) — results that are beyond two standard deviations.
So, in our case, to find all the pupils who have a comparably different reading age than everyone else, all we need to do is identify reading ages that are beyond two standard deviations.
The beauty of R is that this can all be done in just a few lines of R-code. No maths skills are necessary.
Let’s R
First, import the spreadsheet containing the reading ages you exported from your school’s MIS:
# Import your data into R
df_reading_age <- read.csv("my_exported_data.csv")
Tell R to calculate two things: (i) the mean and (ii) the standard deviation.
# Import the tidyverse package
library(tidyverse)

# Compute mean and standard deviation and save it as df_stats
df_stats <- df_reading_age |>
  summarise("Mean" = mean(Reading.Age), "StDev" = sd(Reading.Age))
# View results
df_statsSince dyslexia is a trait where people have comparably lower reading ability, all we have to do is subtract the standard deviation twice from the mean:
\[\textrm{mean} - (2 \times \textrm{standard deviation})\] \[= 11.025 - (2 \times 1.9259599)\] \[= 7.1730802\]
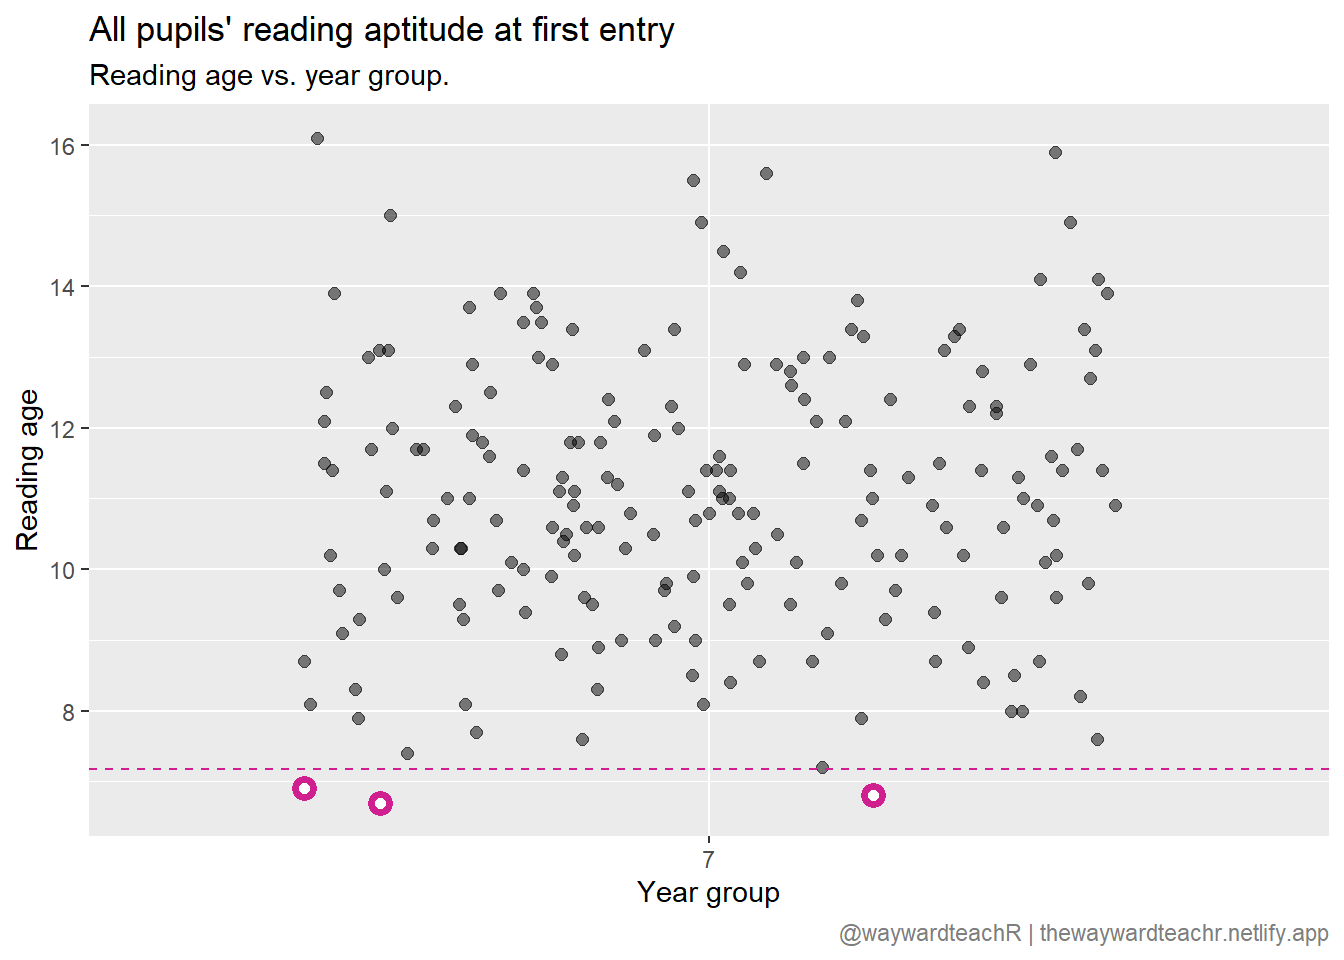
And there you have it: pupils in Y7 with a reading age lower than 7.2 are defined as significantly weaker than their peers in Y7. To find out who they are, type
df_reading_age |>
  filter(Reading.Age < df_stats$Mean - (2 * df_stats$StDev))
There appears to be three such pupils.
Corrections
If you spot any mistakes or want to suggest changes, please let me know through the usual channels.
Footnotes
Continuous phenomena are those that can take any numerical value; for example, hand span, shoe size, etc.. Discontinuous phenomena are those that only take discrete values; for example, blood group, gender, etc.↩︎
The normal distribution takes the equation \(Y = \frac{1}{\sigma \sqrt{2 \pi}}e^{-\frac{X - \mu^2}{2 \sigma^2}}\)↩︎
Citation
BibTeX citation:
@online{teachr2022,
  author = {teachR, wayward},
  title = {R in School: The {SENCo}},
  date = {2022-07-23},
  url = {https://thewaywardteachr.netlify.app/posts/2022-07-23-r-in-school-dyslexia/r-in-school-dyslexia.html},
  langid = {en}
}
For attribution, please cite this work as:
teachR, wayward. 2022. “R in School: The SENCo.” July 23,
2022. https://thewaywardteachr.netlify.app/posts/2022-07-23-r-in-school-dyslexia/r-in-school-dyslexia.html.