wait are you kidding me pic.twitter.com/LULzjAf5tJ
— Adam Smith (@asmith83) July 19, 2022
There was a TikTok video doing its rounds on Twitter a few weeks ago. The video showed a person importing a table from a Wikipedia page into Excel without having to copy-paste.
Though I replied to the tweet to show how it can be done in R, I thought I should explain it a little more here.
Programmatically extracting information from webpages is known as scraping. In order to scrape, you will need to use the {rvest} package. 1 {rvest} is part of the {tidyverse} set of packages; so, if you installed the {tidyverse}, you are good to go. If you don’t have it installed, however, do so now.
# Install rvest
install.packages("rvest")
In order to make this as easy as possible, let’s break the whole thing down into a series of steps.
Step 1: import package
To use a package in R, it needs to be imported. This is done using the library() function. Let’s import the {rvest} package.
# Import rvest
library(rvest)
Step 2: the URL
Now we need to tell R the URL that contains our table. The one we are interested in today is the main table over on the Dow Jones Industrial Average Wikipedia page.
# Define url
my_url <- "https://en.wikipedia.org/wiki/Dow_Jones_Industrial_Average"
Step 3: read
Use the function read_html() to get R to read our URL.
# Read
my_website <- read_html("https://en.wikipedia.org/wiki/Dow_Jones_Industrial_Average")
Step 4: identify the element
Webpages are made up of lots of different elements. What we need now is the name of the element that contains our table. To find that out
- right click the table heading on the Wikipedia page;
- click on
inspectwhen the context menu pops up; - make a note of the name of the table from the inspection panel.
Here is a visual demonstration.
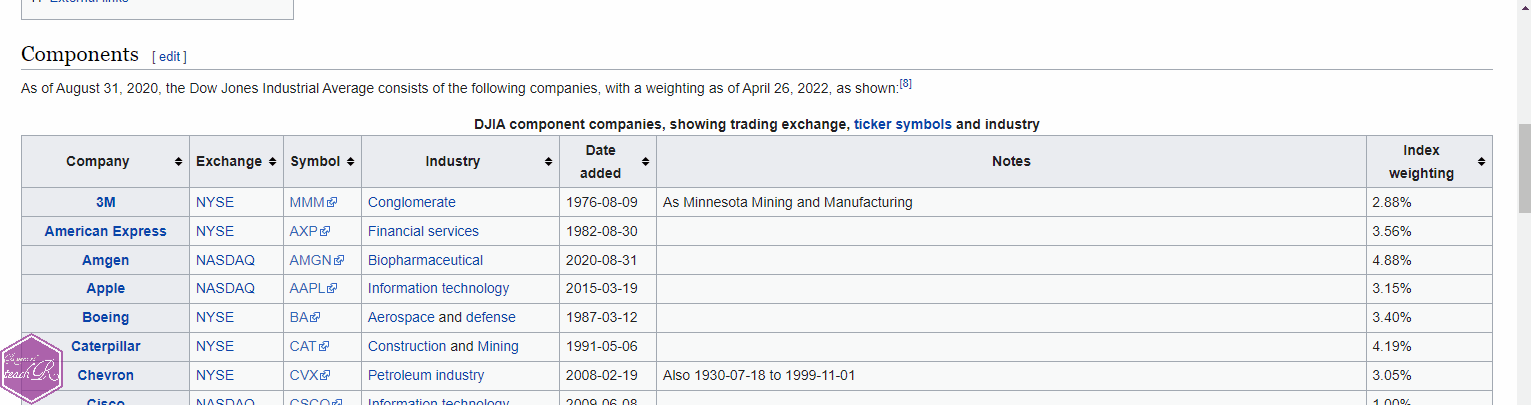
Our table is called wikitable sortable. The name of the element becomes table.wikitable.sortable. Armed with this information, we are ready to extract our table.
Step 5: extract table
my_table <- my_website |>
  html_element("table.wikitable.sortable") |>
  html_table()
There you go. Done.
Full code
Corrections
If you spot any mistakes or want to suggest changes, please let me know through the usual channels.
Footnotes
There are other packages for more complex webpages, but {rvest} is all we need for this task.↩︎
Citation
BibTeX citation:
@online{teachr2022,
  author = {teachR, wayward},
  title = {R Shorts: Webpage Tables},
  date = {2022-08-22},
  url = {https://thewaywardteachr.netlify.app/posts/2022-08-22-r-shorts-web-tables/r-shorts-web-tables.html},
  langid = {en}
}
For attribution, please cite this work as:
teachR, wayward. 2022. “R Shorts: Webpage Tables.” August
22, 2022. https://thewaywardteachr.netlify.app/posts/2022-08-22-r-shorts-web-tables/r-shorts-web-tables.html.