Prior attainment
At the end of primary school, 11-year olds sit standardised tests in English and maths. If you are interested, you can see what these tests look like by heading over to the DfE.
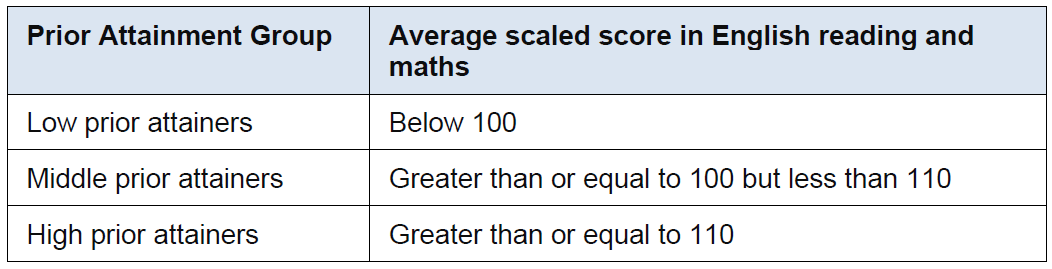
Once the tests have been marked, government bean counters pore through the results and come up with scaled scores for each pupil. In true bureaucratic desire to categorise everything and everyone, the scaled scores are then used to label each pupil as high-, middle-, or low-attaining. On page 25 of the DfE’s guidance on secondary accountability measures, there is a table that defines this process.
The prior in prior attainment is what makes these figures interesting. In five years’ time (hence, prior), these results will be used to judge if a pupil has made adequate progress (and, by extension, if a school has made adequate progress).
Prior attainment from performance tables
At the end of high school, a similar story unfolds: pupils sit GCSEs, government mandarins do their thing, performance tables are published. As part of the performance tables dataset, the government also release information on prior attainment for that cohort.
If you head over to the DfE’s performance tables website, download the full dataset for 2022-2023 and faff around long enough, you can extract the prior attainment percentages for each school, local authority, and the country as a whole. Given below are the national figures for maintained schools.
The obvious question then is: how does this compare with previous cohorts?
The problem with this question is that the method of testing changed in 2016 (Y11 class of 2021), compounded by two years of covid where the government did not publish any data pertaining to performance tables. Nonetheless, if you head over to the DfE’s performance tables website, you can download the full datasets for years that are available.
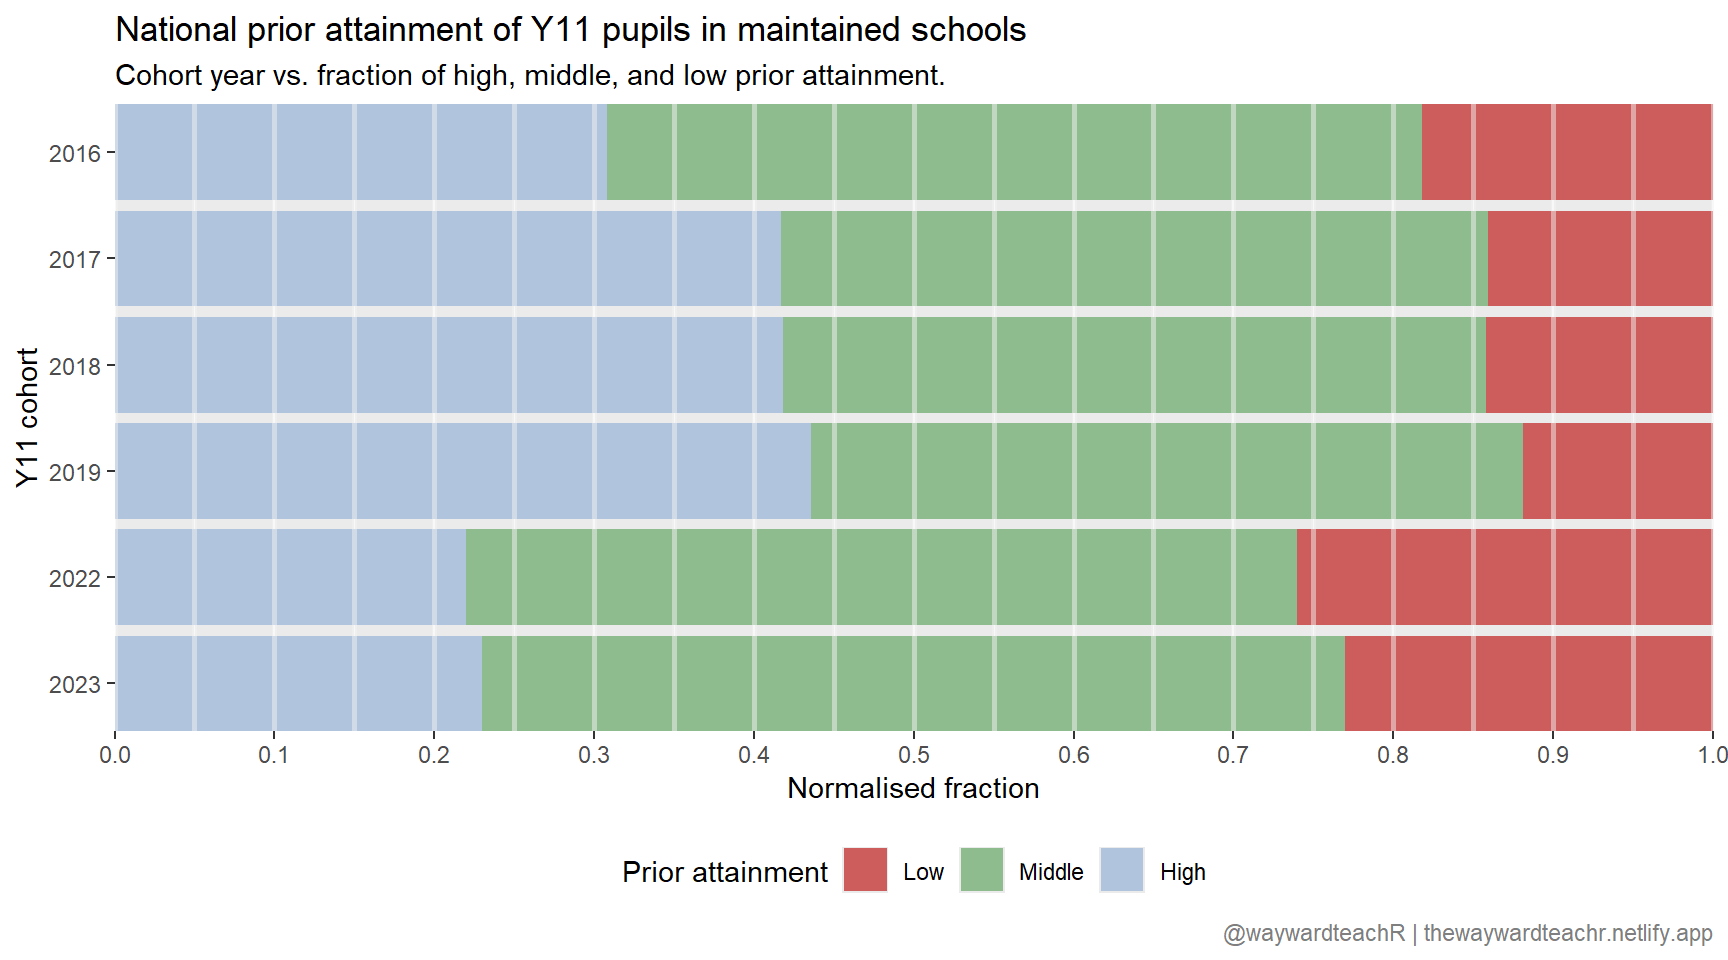
Note the missing cohorts and the marked difference in percentage prior attainment on going from 2019 to 2022 (due to the new method of testing (scaled scores)).
Attainment and progress
Once the dust settles from the yearly circus of GCSE exam results, the government, in autumn of the same year, publish provisional GCSE attainment figures for all the KS2 scaled scores — recall that these are from tests sat by the same pupils five years prior. In everyday speak, interpreting this dataset goes something like this: “pupils who had a KS2 scaled score of x tended to attain y at GCSE”. Of course, this creates a circus of its own and, once that dust settles, a final mapping of the scores is published at the end of winter. These are called attainment averages for prior attainment groups.
Here is a trimmed and sanitised version of the final prior attainment dataset for the 2023 Y11 cohort.
Where A8.Av is the average GCSE attainment across eight subjects. Note, however, that English and maths are counted twice; therefore, dividing this number by 10 gives you the average GCSE grade a pupil got in that prior attainment group.
Again, in everyday speak: on average, a pupil whose KS2 scaled score was, for example, 92.5 tended to average a grade 2.569 across 10 GCSEs. If a given pupil actually averaged 3, his progress is
\[3 - 2.569 = 0.431\]
Comparing cohorts
2022 vs. 2023
Now that we have two years’ of attainment averages and KS2 prior attainment data, let’s have a look at how attainment averages are related to KS2 prior attainment for the two cohorts.
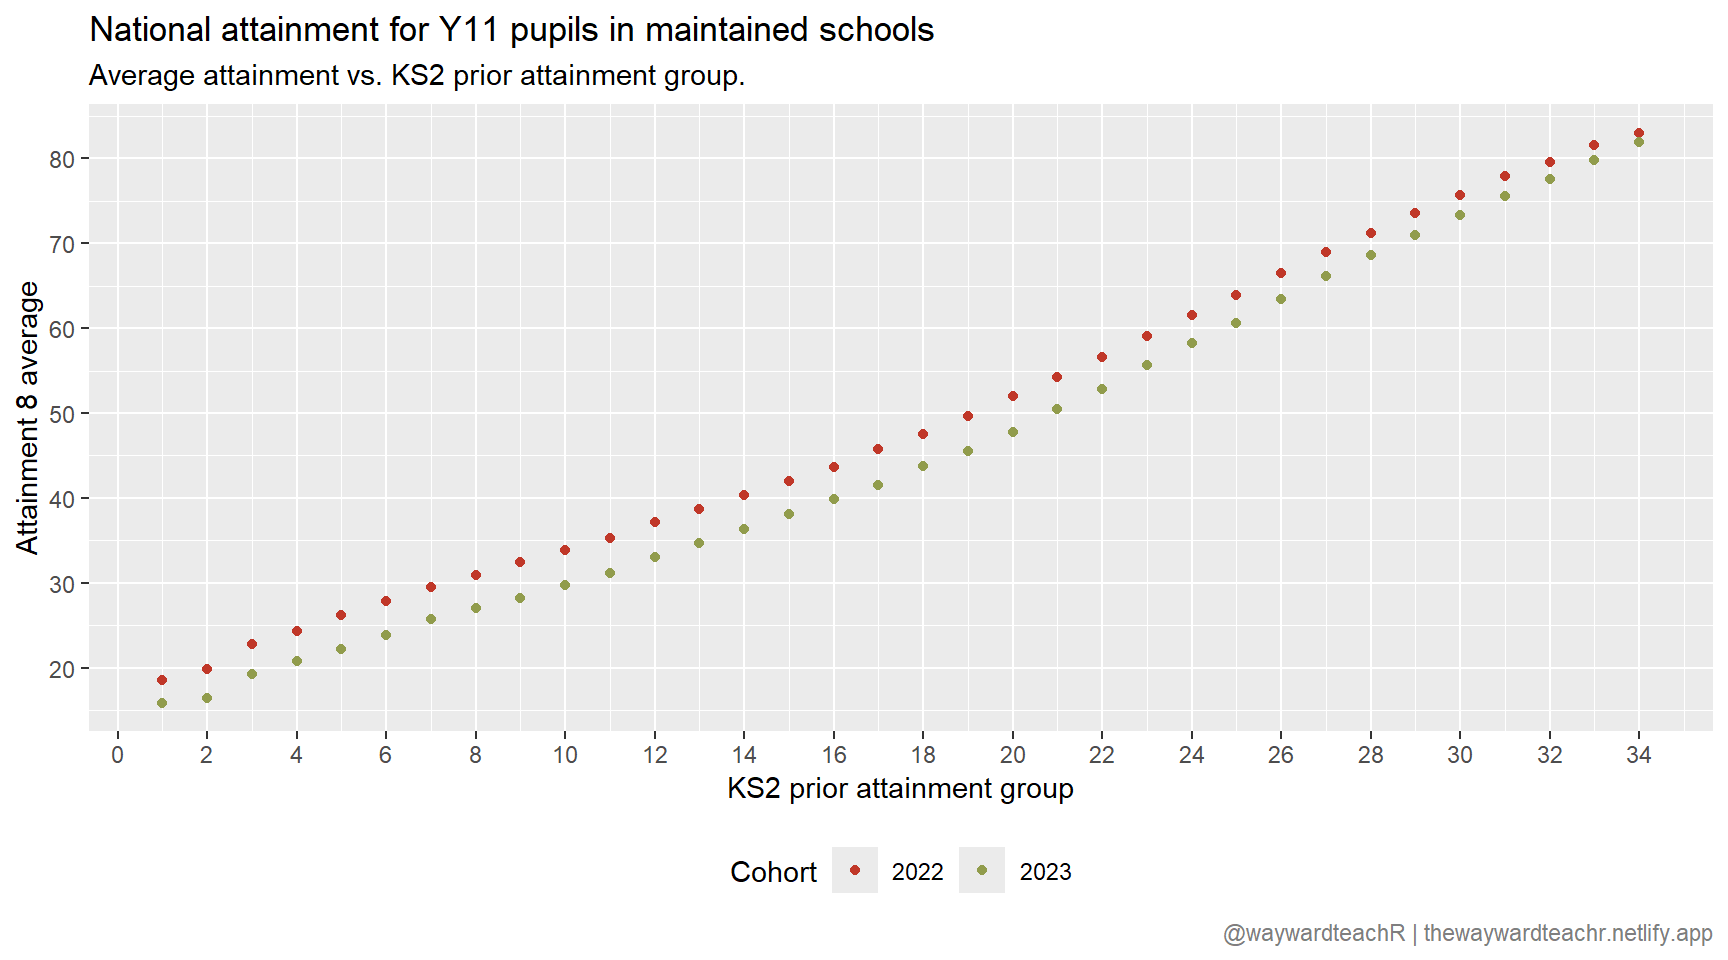
For every KS2 prior attainment group, it appears that the 2023 cohort’s average attainment was lower than that of the 2022 cohort. The politics of why this is the case will be familiar to those in the education game: after three years of grade inflation, the government made good on their promise to realign grades in line with the pre-pandemic 2019 cohort. The only way of doing this is by lowering attainment.
Let’s set the 2022 dataset as the baseline and compute the difference for 2023.
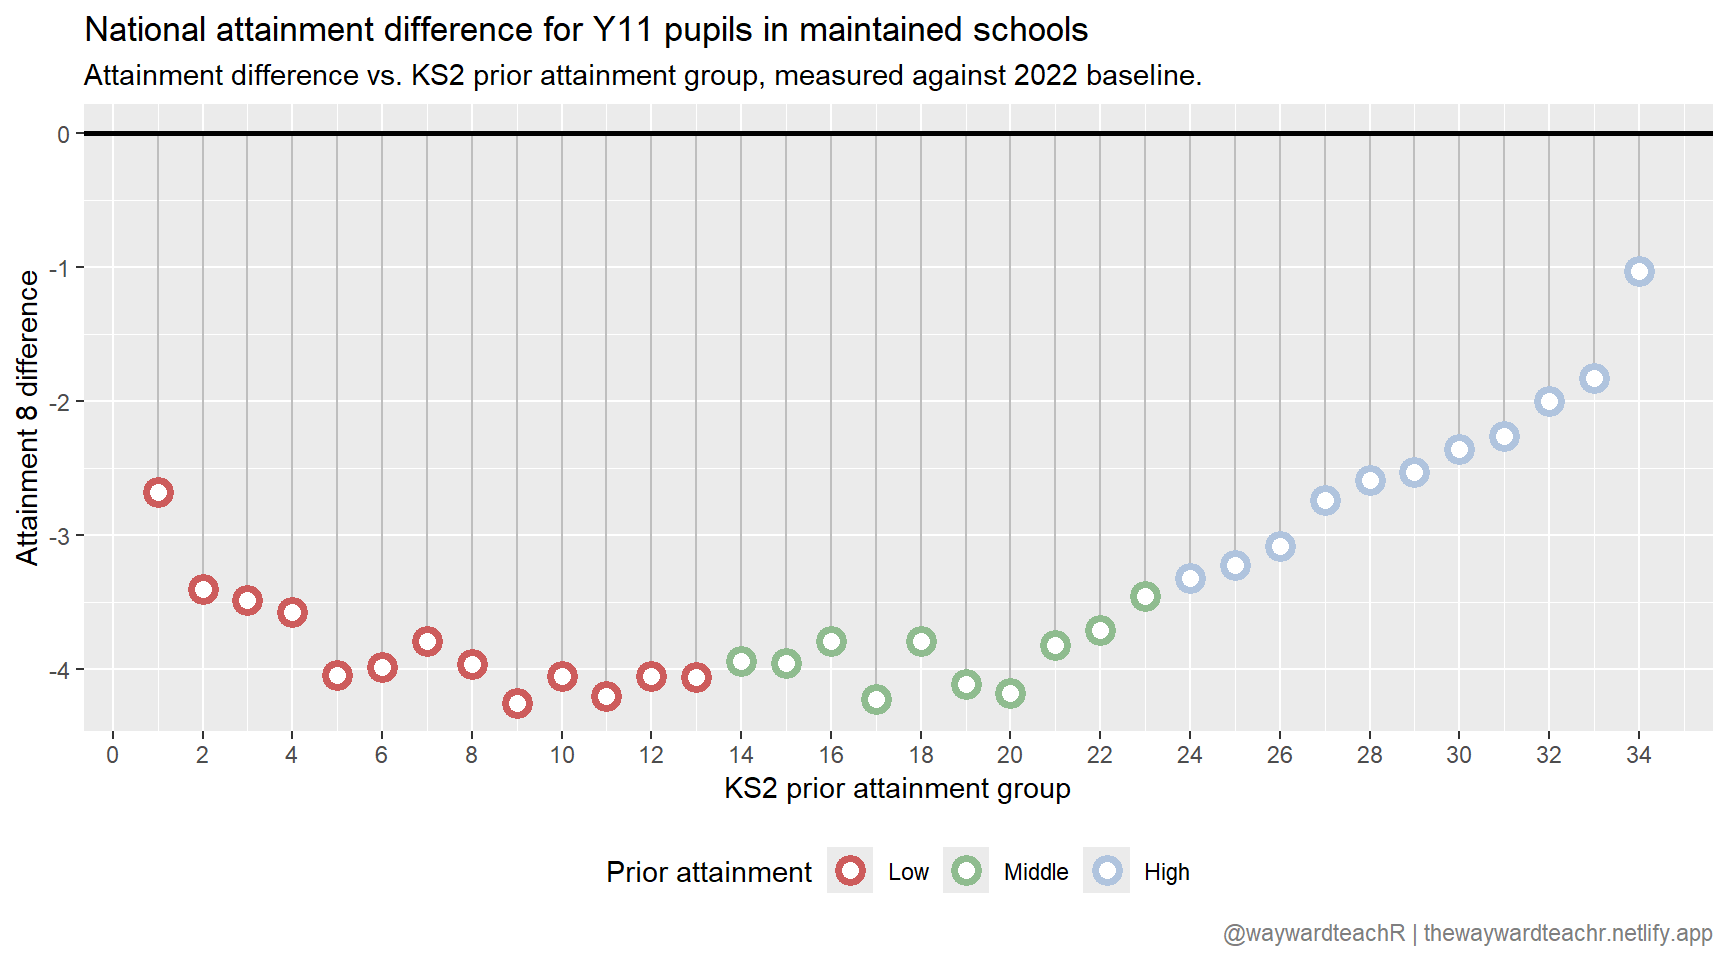
It looks like government mandarins at the DfE applied the highest grade correction to pupils in the low and middle parts of the prior attainment spectrum.
The question now is: how much more grade correction can we look forward to? In order to answer that, we need to graple with the 2019 dataset — the government’s egalitarian baseline for grade distribution.
2019 vs. 2023
It is not possible to directly compare the 2019 cohort with the 2023 cohort, because the former’s attainment figures are given relative to fine levels whilst the latter’s are given relative to scaled scores within prior attainment groups.
However, where there is maths, there is always a way.
In the 2019 dataset, there are 34 KS2 fine levels ranging from 1.5 to 5.8. In comparison, the 2023 dataset has 34 KS2 prior attainment groups ranging from 1 to 34, each with their own scaled scores.
Given that both datasets are the same size (34), fine levels can simply be substituted for prior attainment groups; this is naïve, however, and leads to the loss in relative density of the test scores. Instead, the 2019 KS2 fine levels can be scaled and mapped to the 2023 prior attainment groups using the following transformation:
\[a \mapsto \frac{a - b_{\textrm{min}}}{b_{\textrm{max}} - b_{\textrm{min}}} \times (c_{\textrm{max}} - c_{\textrm{min}}) + c_{\textrm{min}}\]
where
\(a\) is the fine level to be mapped;
\(b_{\textrm{min}}\) is the minimum in the range of 2019 fine levels;
\(b_{\textrm{max}}\) is the maximum in the range of 2019 fine levels;
\(c_{\textrm{min}}\) is the minimum in the range of 2023 prior attainment group;
\(c_{\textrm{max}}\) is the maximum in the range of 2023 prior attainment group.
Here is what the transformation looks like.
Notice the duplication of some KS2 prior attainment groups. This is because multiple fine levels map to a single prior attainment group in order to maintain the same relative density. To overcome this, we can aggregate the duplicate prior attainment groups and calculate a mean.
Here is what the final transformation looks like.
Putting all this together into understandable form, we have
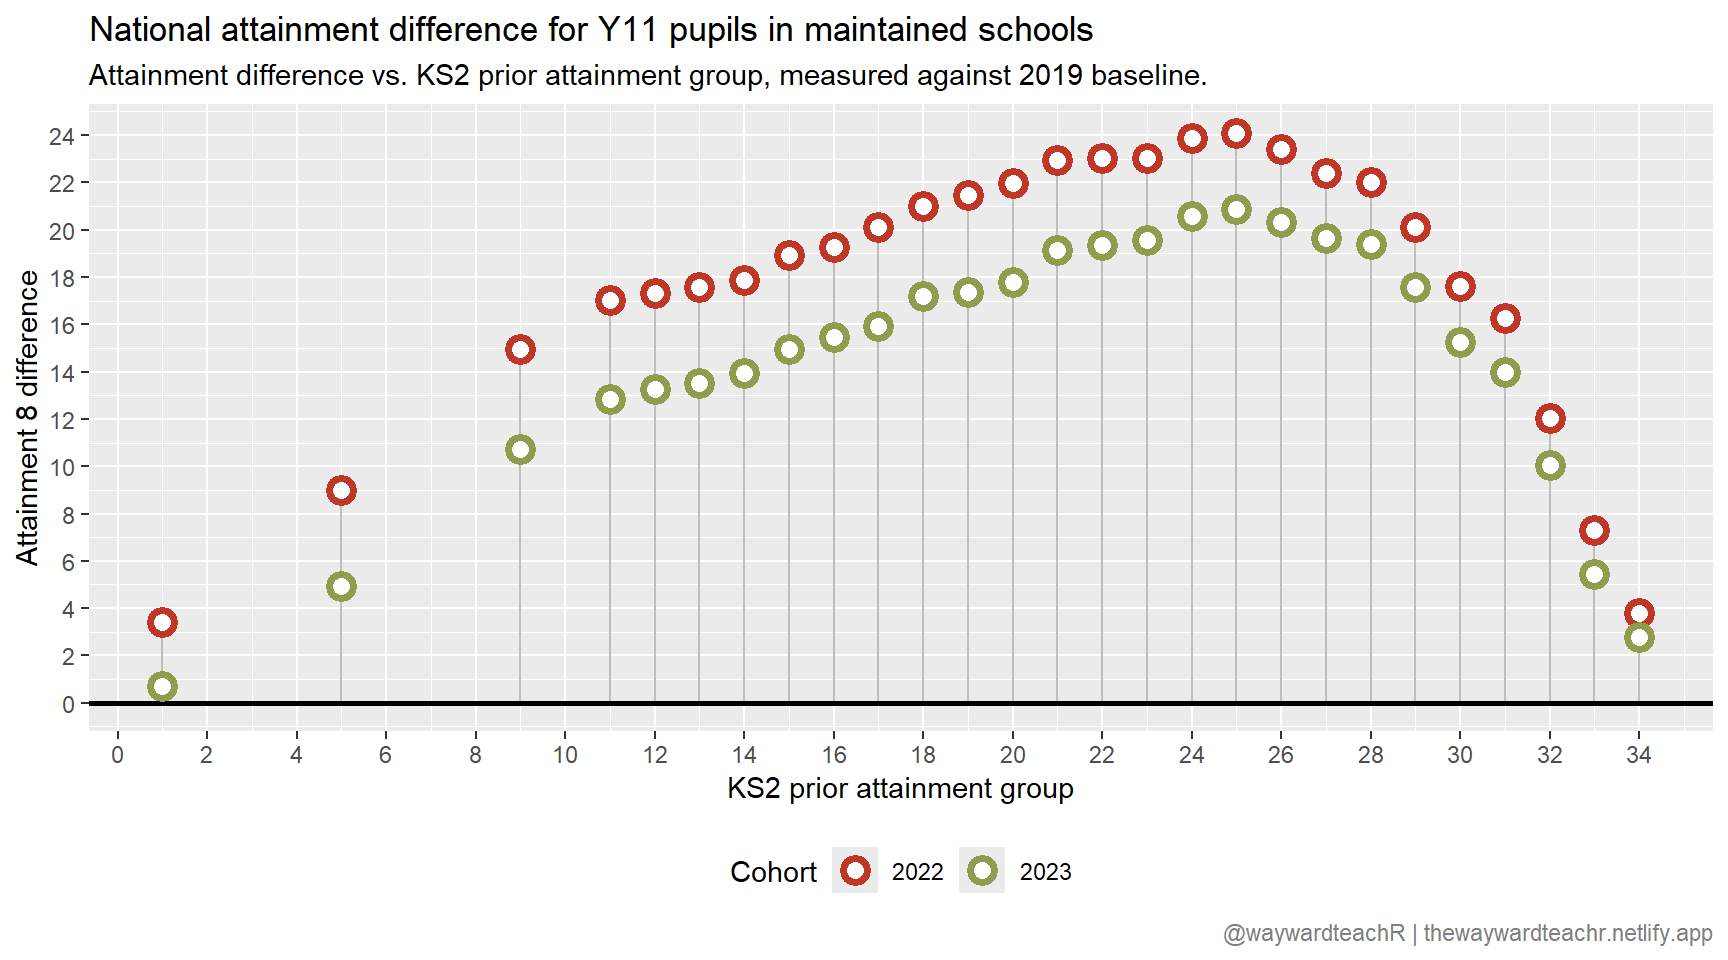
There are two main points to make here.
- There are many more years of grade correction to look forward to.
- Grade inflation peaks at KS2 prior attainment 25 for both cohorts, which corresponds to pupils in the high prior attainment group.
- A greater magnitude of grade correction is disproportionately applied to pupil in the low and middle prior attainment groups.
For point three, it can be argued that this is because — overall — more grade inflation happened in the low and middle prior attainment groups relative to 2019.
Future direction
In a future post, I hope to tie all this together with a look at the distribution of prior attainment groups across the country.
That is all for now.
Corrections
If you spot any mistakes or want to suggest changes, please let me know through the usual channels.
08 August, 2024
- Minor typo fixes.
- Updated colour palette used on plots.
Citation
BibTeX citation:
@online{teachr2024,
  author = {teachR, wayward},
  title = {Prior Attainment},
  date = {2024-07-28},
  url = {https://thewaywardteachr.netlify.app/posts/2024-07-28-national-pa/national-pa.html},
  langid = {en}
}
For attribution, please cite this work as:
teachR, wayward. 2024. “Prior Attainment.” July 28, 2024.
https://thewaywardteachr.netlify.app/posts/2024-07-28-national-pa/national-pa.html.