The NRT
The National Reference Test (NRT) was borne out of the Gove-reforms in the mid-2010s. It is a test sat by a few hundred pupils in the spring term before the summer GCSEs. The unlucky few hundred are randomly chosen by government bean counters and affected schools are legally obliged to facilitate the tests.1
The idea behind the NRT was to keep year-on-year grade-inflation in check, using the first cohort to sit the NRT — the Y11 class of 2017 — as a baseline for all future grades. If you want to know how they fared, Ofqual produce a yearly blurb of the NRT which you can find here.
There are two longitudinal plots in the linked Ofqual article, but I don’t like them; so, with a little elbow grease, I extracted the data and plotted my own.
Bizzarely, the figures differ from the same blurb they produced in 2022, though only marginally.
Using the NRT
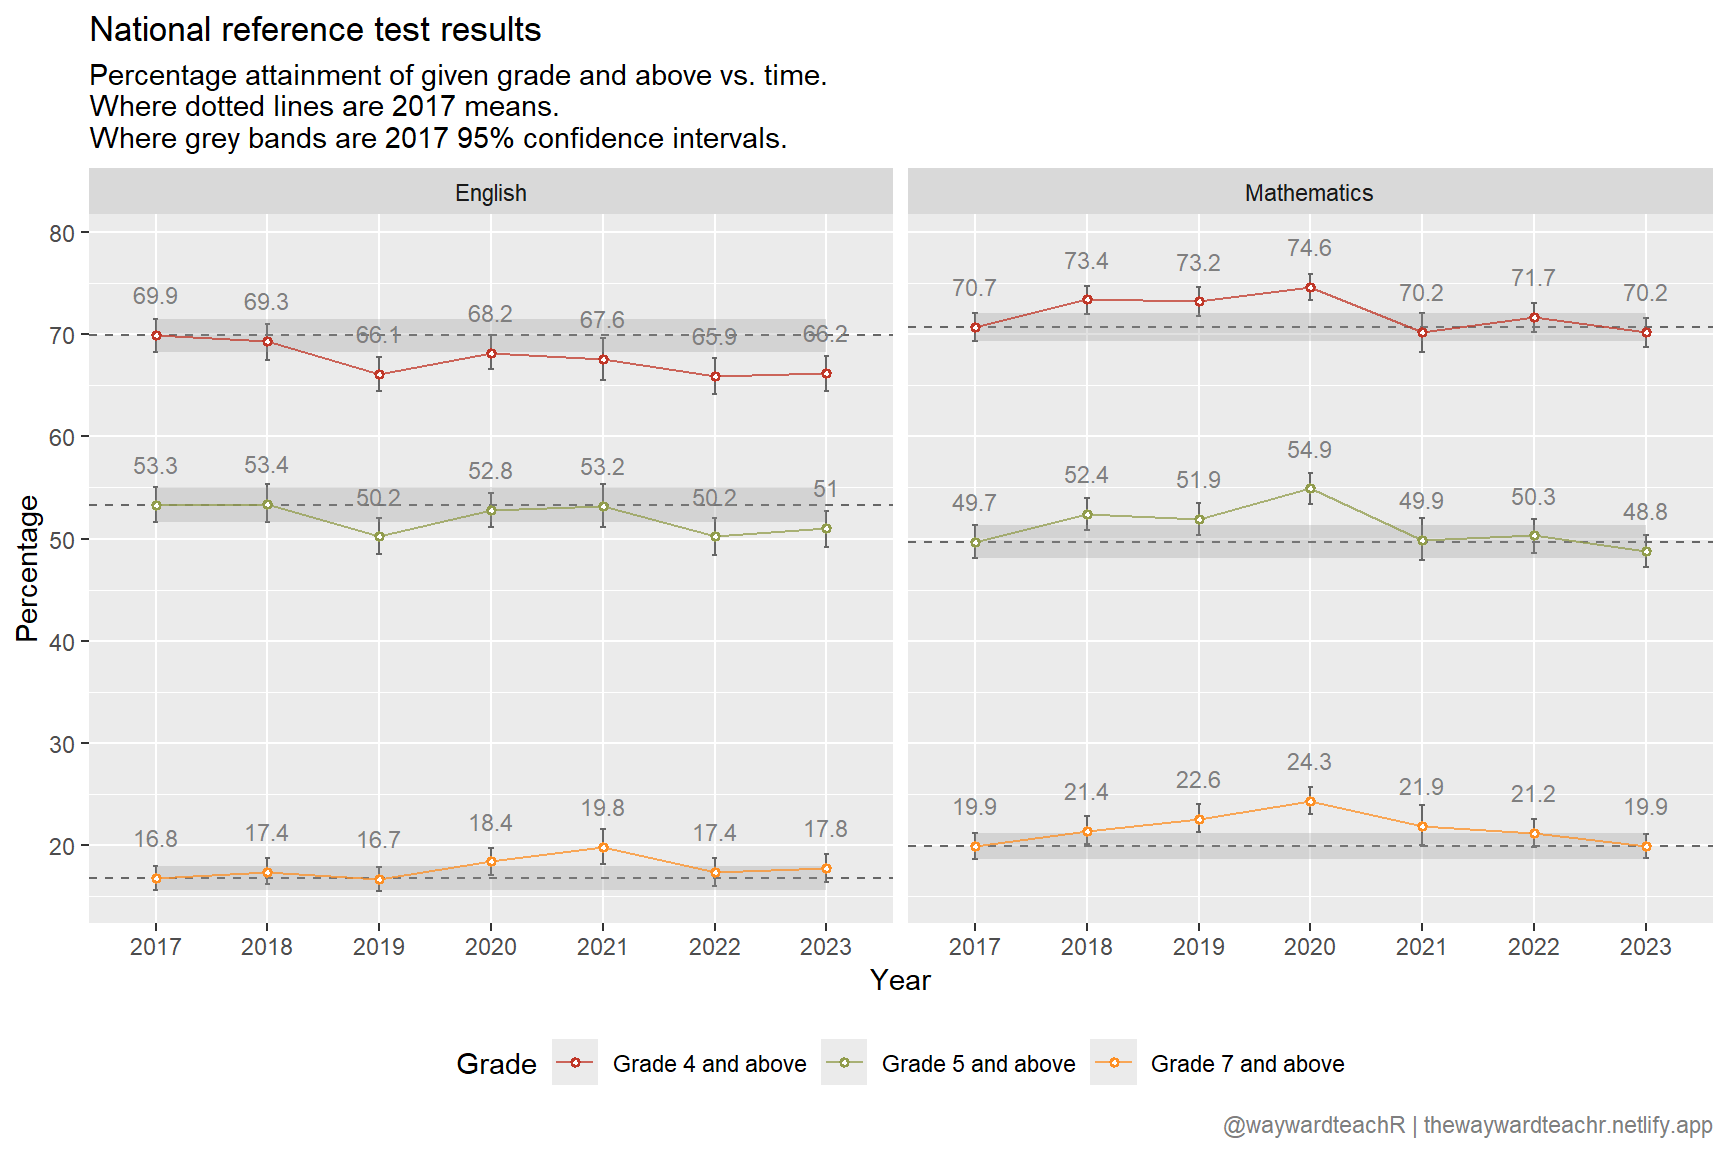
Now that we know the 2017 cohort was supposed to be a baseline for all subsequent year groups, let’s compare it to the 2019 cohort.
The comparison above suggests that the 2019 cohort was, at grade 4+ in English, a weaker year group than the 2017 cohort (66.1% cf. 69.9%) by 3.8%. The 2019 cohort, therefore, should receive 3.8% fewer grades in English at grade 4+.
That is, in a nutshell, how it is supposed to work. But does it actually?
Watching the watchmen
Isn’t it peculiar that nowhere in Ofqual’s blurb does it compare the NRT results to actual GCSE results?
Anyway, there are two places you can go to get GCSE exam results yourself.
- The JCQ.
- The DfE’s KS4 performance tables, which is an open subset of the government’s dystopian National Pupil Database.
Oh, and neither of these make any mention of the NRT. It is like they are deliberately trying to make it hard for anyone outside to make comparisons.
JCQ
The JCQ dataset is okay, but there are some problems with it.
- Percentages for grades 4+, 5+, and 7+ are given for the whole population. In other words, it includes grades attained by
- pupils older than 16 (college resits and mature pupils);
- pupils younger than 16 (early entrants from lower years), and
- pupils in non-DfE-funded schools, PRUs, and special schools. Note that the NRT is a measure of strength of 16-year olds in DfE-funded schools.
- The 2017 and 2018 datasets only exist in
.pdfdocuments. Extracting the data from these into usable form is a terrible waste of my time; so, I am not doing it.
Having said that, I expect the errors due to point one to be marginal. As for point two: who cares? Let’s plot what we have.
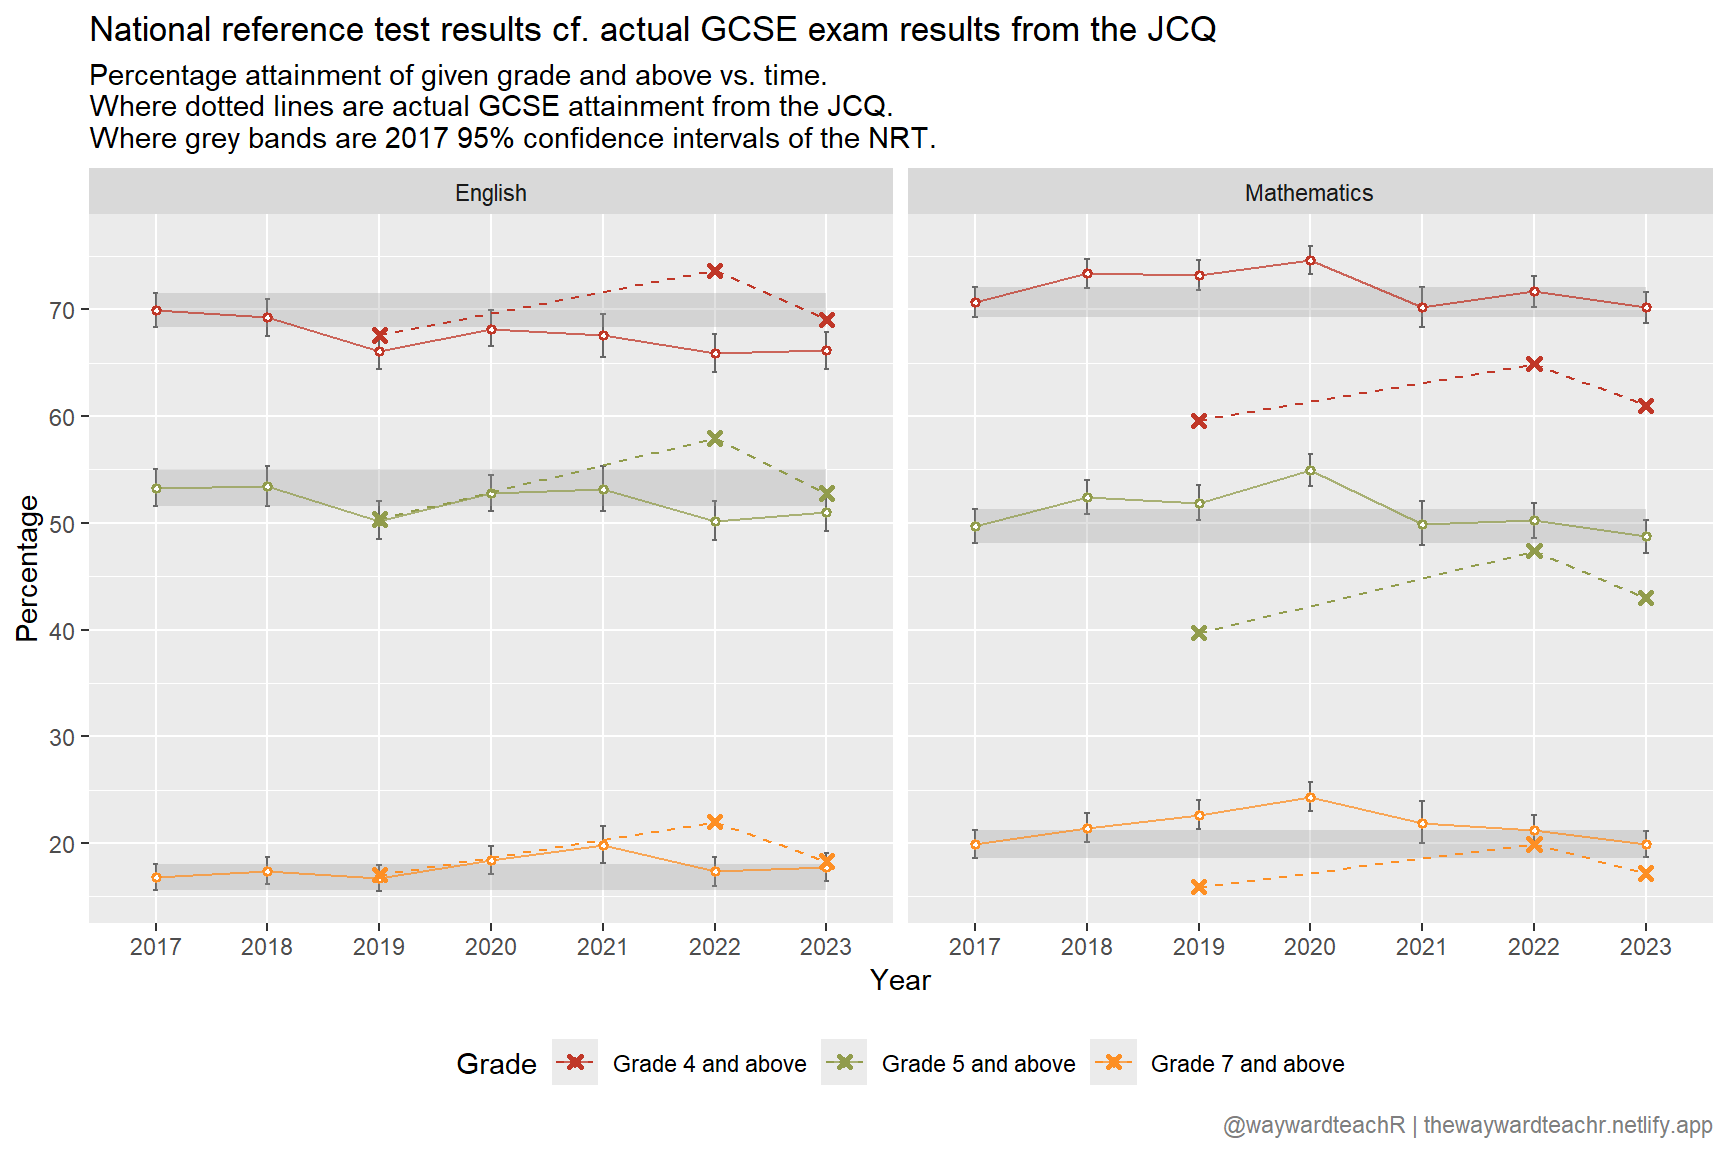
Note: the results shown for English are the mean averages of Enlish language and English literature.
It looks to me, there was over-awarding going on in English in 2022, but near perfect under-awarding in mathematics (the exception being grade 7+ in 2022).
Performance tables
The performance tables dataset has four columns of interest to us: percentage ebac English and percentage ebac mathematics, both offered at grades 4+ and 5+. Grades 7+ are not given.
Also, the national dataset is limited to all schools and maintained schools. I obviously don’t want the numbers for all schools, but beware that the figures for maintained schools will include PRUs and special schools. The great thing though is that colleges are not included in the figures.
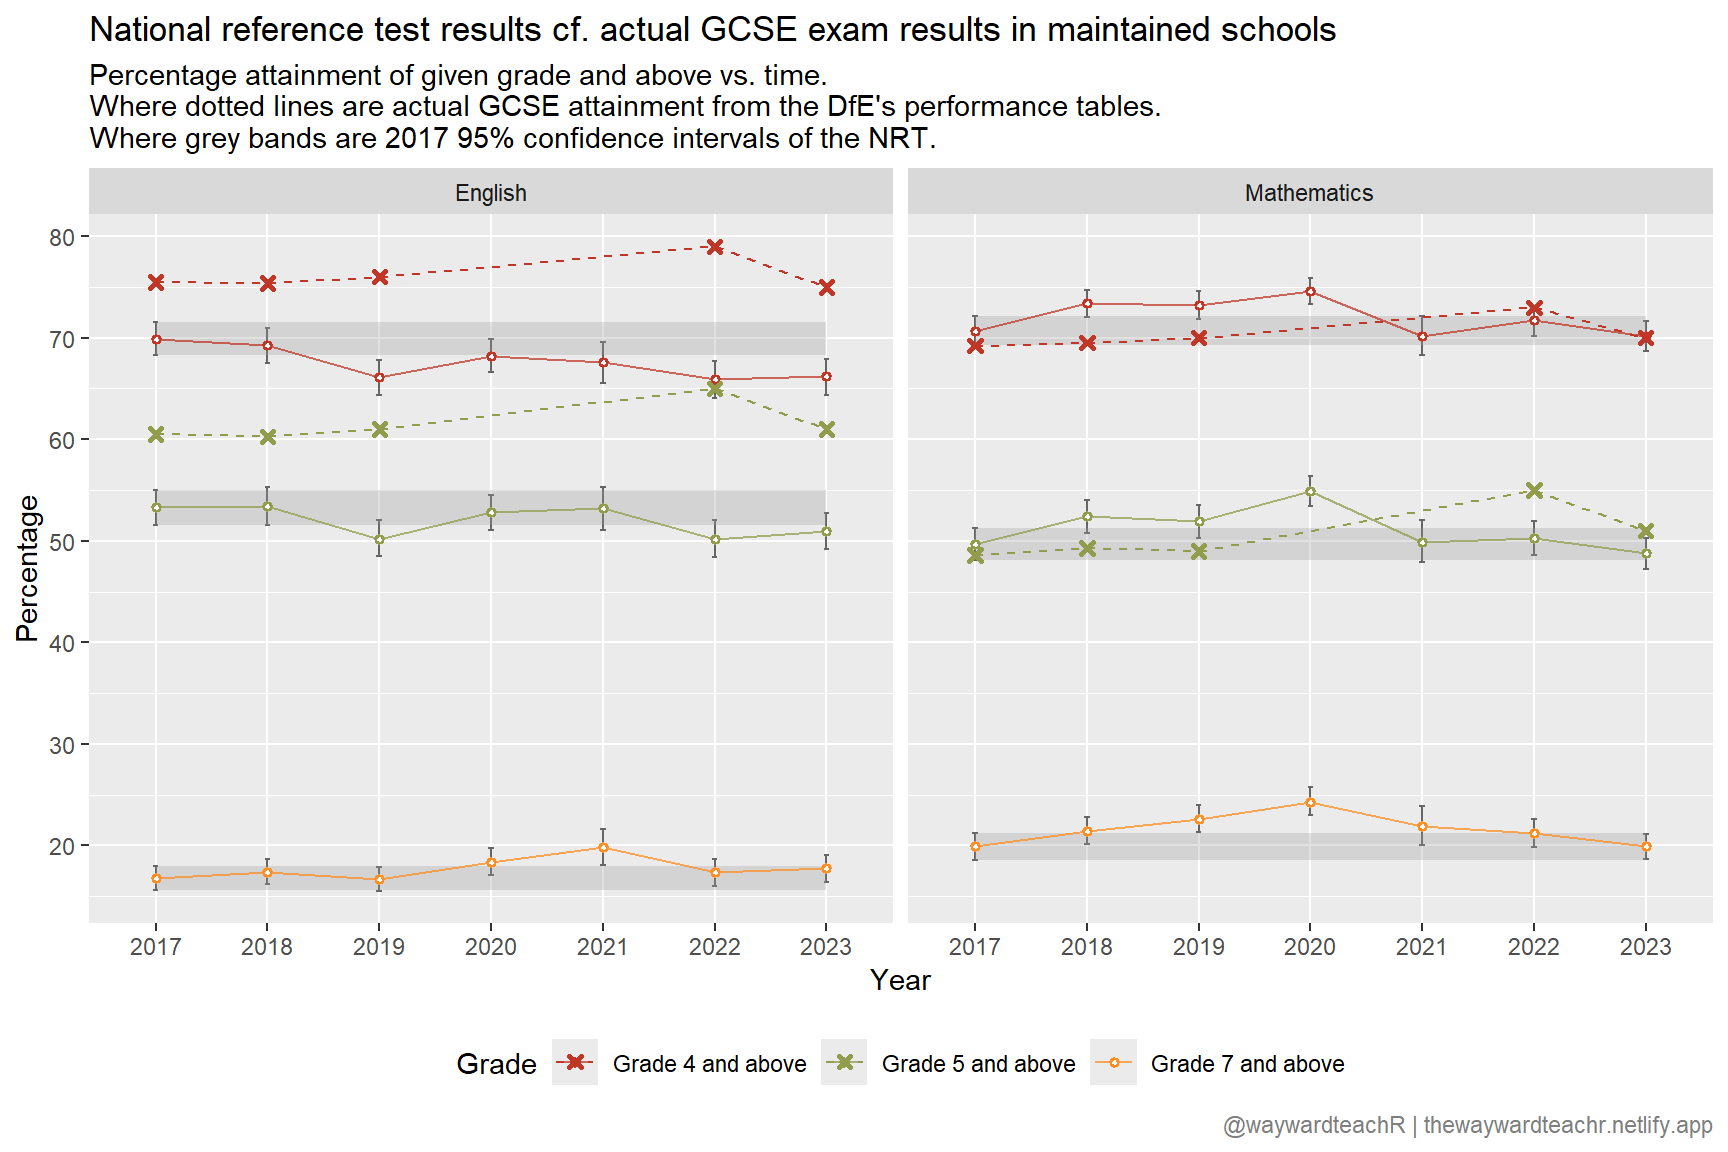
It looks different to the JCQ data, that’s for sure. Hyper-inflationary grades in English, while mathematics is more tamed.
Summary
The DfE and their organs can so easily provide us with all the data we need to make meaningful comparisons; yet, they do everything possible to make it difficult (data buried in .pdf; data in different formats; aggregated data releases that are not comparable; etc.). I guess the mandarins have to justify their existence, huh?
Corrections
If you spot any mistakes or want to suggest changes, please let me know through the usual channels.
Footnotes
https://www.gov.uk/government/publications/national-reference-test-your-information-and-your-privacy/background-report-national-reference-test-information#the-survey-sample↩︎
Citation
BibTeX citation:
@online{teachr2024,
  author = {teachR, wayward},
  title = {National Reference Test},
  date = {2024-08-12},
  url = {https://thewaywardteachr.netlify.app/posts/2024-08-12-national-reference-test/national-reference-test.html},
  langid = {en}
}
For attribution, please cite this work as:
teachR, wayward. 2024. “National Reference Test.” August
12, 2024. https://thewaywardteachr.netlify.app/posts/2024-08-12-national-reference-test/national-reference-test.html.